pgc all green working and signpost with lettering new colour 2
Follow Palmers Green Community on Facebook Follow Palmers Green Community on Twitter Follow Palmers Green Community on Bluesky

Share share on facebook share on twitter share on Bluesky Article Print View

Statistics provided by Cycle Enfield show that the number of people riding bikes past an automatic count point at Palmers Green Triangle has been steadily rising over the last four months,

In February trips past the counter in either direction totalled 7,343.  By May this measure had risen to 11,166.  Average weekday trips rose from 304 a day in February to 396 a day in May.

The technology for counting trips uses an inductive loop inserted 2 to 5cm under the surface of the lane. Each time a bicycle goes over the loop, the system detects the electromagnetic signature of both wheels and registers a count.

These figures are just for bicycles passing the Triangle.  There will, of course, be many more riders using other parts of the A105 cycle lanes, which go almost as far as Enfield Town, but no figures are available for other sections.

May 2019 graphic 460x459April 2019 graphic 460x459

March 2019 graphic 460x458Feb 2019 graphic 460x460

Log in to comment
Neil Littman posted a reply
06 Jun 2019 12:58
Actually the stats don't show that more people are making cycle journeys.

The figures show the number of individual journeys have gone up. This could be the same number of people making more journeys. There is no correlation between number of journeys and the number of people.

No figures are available for other sections of the cycle lanes up to Enfield Town because there is only one other counting device which is located outside Pizza Express at Winchmore Hill and I think if the figures for this location were published it would show a massive fall off in number of journeys. The hub at Palmers Green Triangle is probably the busiest place on the route.

The last survey carried out at the Winchmore Hill location was by TfL In 2017 and the numbers were 200 journeys (not people) per day over a period of a week.

By comparison in one location in Hackney (Goldsmiths Row) alone there are 4,500 journeys per day.
Adrian Day posted a reply
06 Jun 2019 16:53
The good news is that number of cycle journeys is increasing - which is likely to mean less polluting vehicles and healthier lives for those cycling. I am a sample of 'one' but I now cycle from Fox Lane to Enfield Town and back (so my journey isn't counted) two to three times week whereas before the cycle lanes I drove. More room on road for buses and those who must drive :)
PGC Webmaster posted a reply
03 Jul 2019 00:56
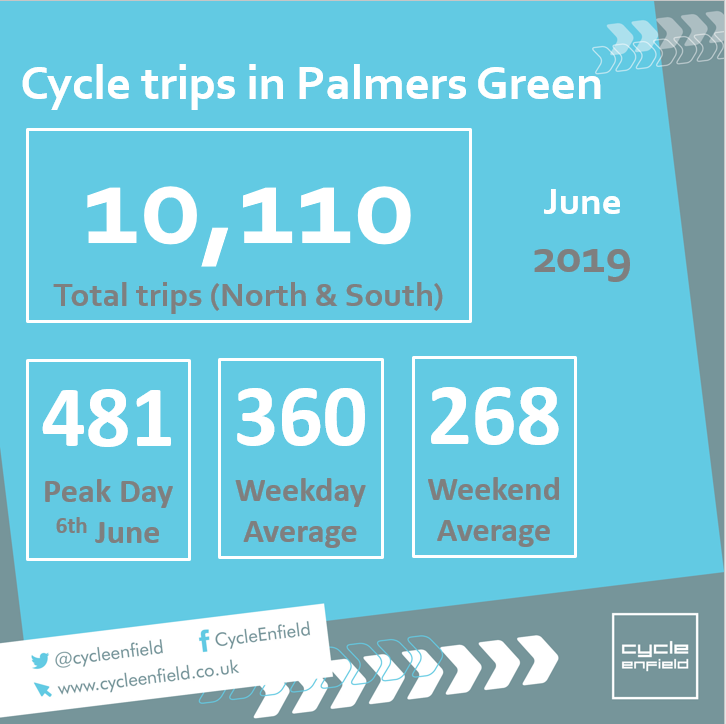
Cycle lane usage, measured at Palmers Green Triangle, was slightly down in June compared with May - possibly because of poor weather


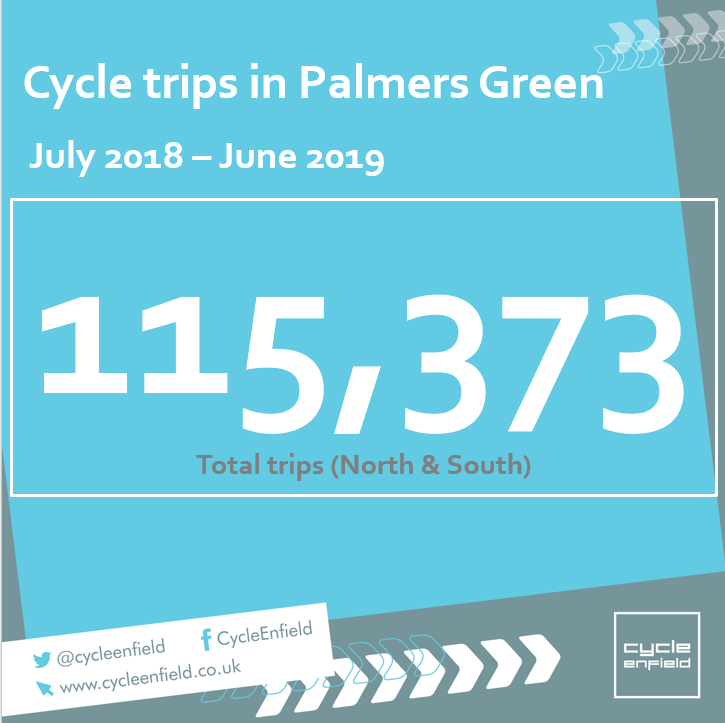
Annual counts show that the cycle lanes are definitely being used, despite what the naysayers claim.


For information about usage further north along the A105, using TfL data, see this page: http://cycleenfield.co.uk/news/evidence-of-change-cycling-on-green-lanes/
Michael Hobbs posted a reply
04 Jul 2019 09:41
Is there any baseline data from the preceding years? Any rational capital investment of this magnitude would baseline the usage and look at the rate of increase over a number of years.
Neil Littman posted a reply
04 Jul 2019 17:45
Not since 2011 according to the stats I have collected. For me the key numbers and questions are:
1. How many cyclists use the lanes, not how many journeys
2. Has the percentage of cyclists in the borough or area gone up. It was 1.4% previously. The lowest in London.
Hackney has 20 times the amount of cycling traffic
3. Why is the date only collected from Palmers Green when there is a measuring device at Winchmore Hi. I think it is because it tapers off dramatically.
Neil Littman posted a reply
04 Jul 2019 17:47
I also just checked the cycle enfield website and the counter in Winchmore Hill is not mentioned in the list of six locations for gathering the data
Basil Clarke posted a reply
04 Jul 2019 20:37
Michael Hobbs wrote:

Is there any baseline data from the preceding years? Any rational capital investment of this magnitude would baseline the usage and look at the rate of increase over a number of years.


The investment is perfectly justified and would be even if there had been a zero per cent increase in cycling along the route.

Two years ago all people cycling along Green Lanes were at an unacceptably high risk of serious injury or death. Now several hundred users of the bike lanes are safer and less stressed. These are people who have chosen the most benign method of transport and who have been comprehensively ignored for many decades. During that time many thousands of cyclists have been killed by drivers who did not take sufficient care or because of road designs that ignored their safety. It is shameful that UK national and local governments have ignored this scandal for so long and I am very pleased to see a change in attitude. It is a simple matter of justice. There is no need to bring cost/benefit analysis into the picture - it is the resort of those who know the price of everything and the value of nothing.

In terms of total money spent on road, the amount spent on cycling infrastructure is absolutely negligible - I don't have any figures to hand, but suspect that it over the last twenty years it will be less than 1 per cent.

This excerpt from a recent newspaper article makes the point:

As Chris Boardman, the cycle campaigner turned cycle tsar for Greater Manchester, noted last month , his planned revamp of the region would cost £1.5bn and would deliver 1,800 miles of safer cycling. That might sound a lot, he said, until you remember that the government has agreed to spend £1.4bn improving a single roundabout in Bedfordshire. So yes, by transport standards, cycling is an absolute bargain.


In any case, cyclists pay for the roads, not just drivers - we all pay out of taxes. On top of that, many cyclists also drive cars, so they too pay the same amount of duty as other drivers. Children don't pay, obviously, but their parents do. And the drivers don't pay their fair share of the "externalities" - the knock-on cost to government of car driving, such as the costs of accidents to the police and health service.
Darren Edgar posted a reply
05 Jul 2019 15:18
@Neil

Hackney has naff all public transport and an extremely well advanced/long established street closure/modal filtering system in place. Therefore it has always, as far as I'm aware, massively outstripped other London boroughs for cycling despite its provision actually being relatively poor.

Pre "trendy" it's also worth noting it was a relatively poor, as well as unconnected, Borough therefore giving weight to the argument that cycling is an important modal shift when considering those on lower incomes too - cars, and even some PT, can be a relative luxury.
0

Find us on Facebook

Follow us on Twitter

Follow us on Bluesky

Clicky